
I joined the company during a pivotal transition: their original product, a digital gift bag, targeted and engaged event attendees for marketers. With the shift, the new product 'Discover' leverages years of data on events, companies, sponsors, and media to empower marketing teams with a deeper understanding of their market.
Companies often lack comprehensive insights about their market landscape. Market research is typically conducted either internally or outsourced to specialized research firms. Either way:
The research is based on past activities, and not current or future ones.
It takes time to reach insights. By that time they are no longer relevant.
Researchers have limited access to all the data and they don't see the whole picture
I joined Everthere when they only had an idea and a jpg format wireframes.
My task was to understand the needs and work closely with the dev team to turn and image into a functioning version ready for development in Figma.

In order to make the deadline, I was loyal to the wireframes that were given to me and postponed design changes until after the MVP version was released.
The scope on the MVP:
Define your world
Define the strategies (Use cases)
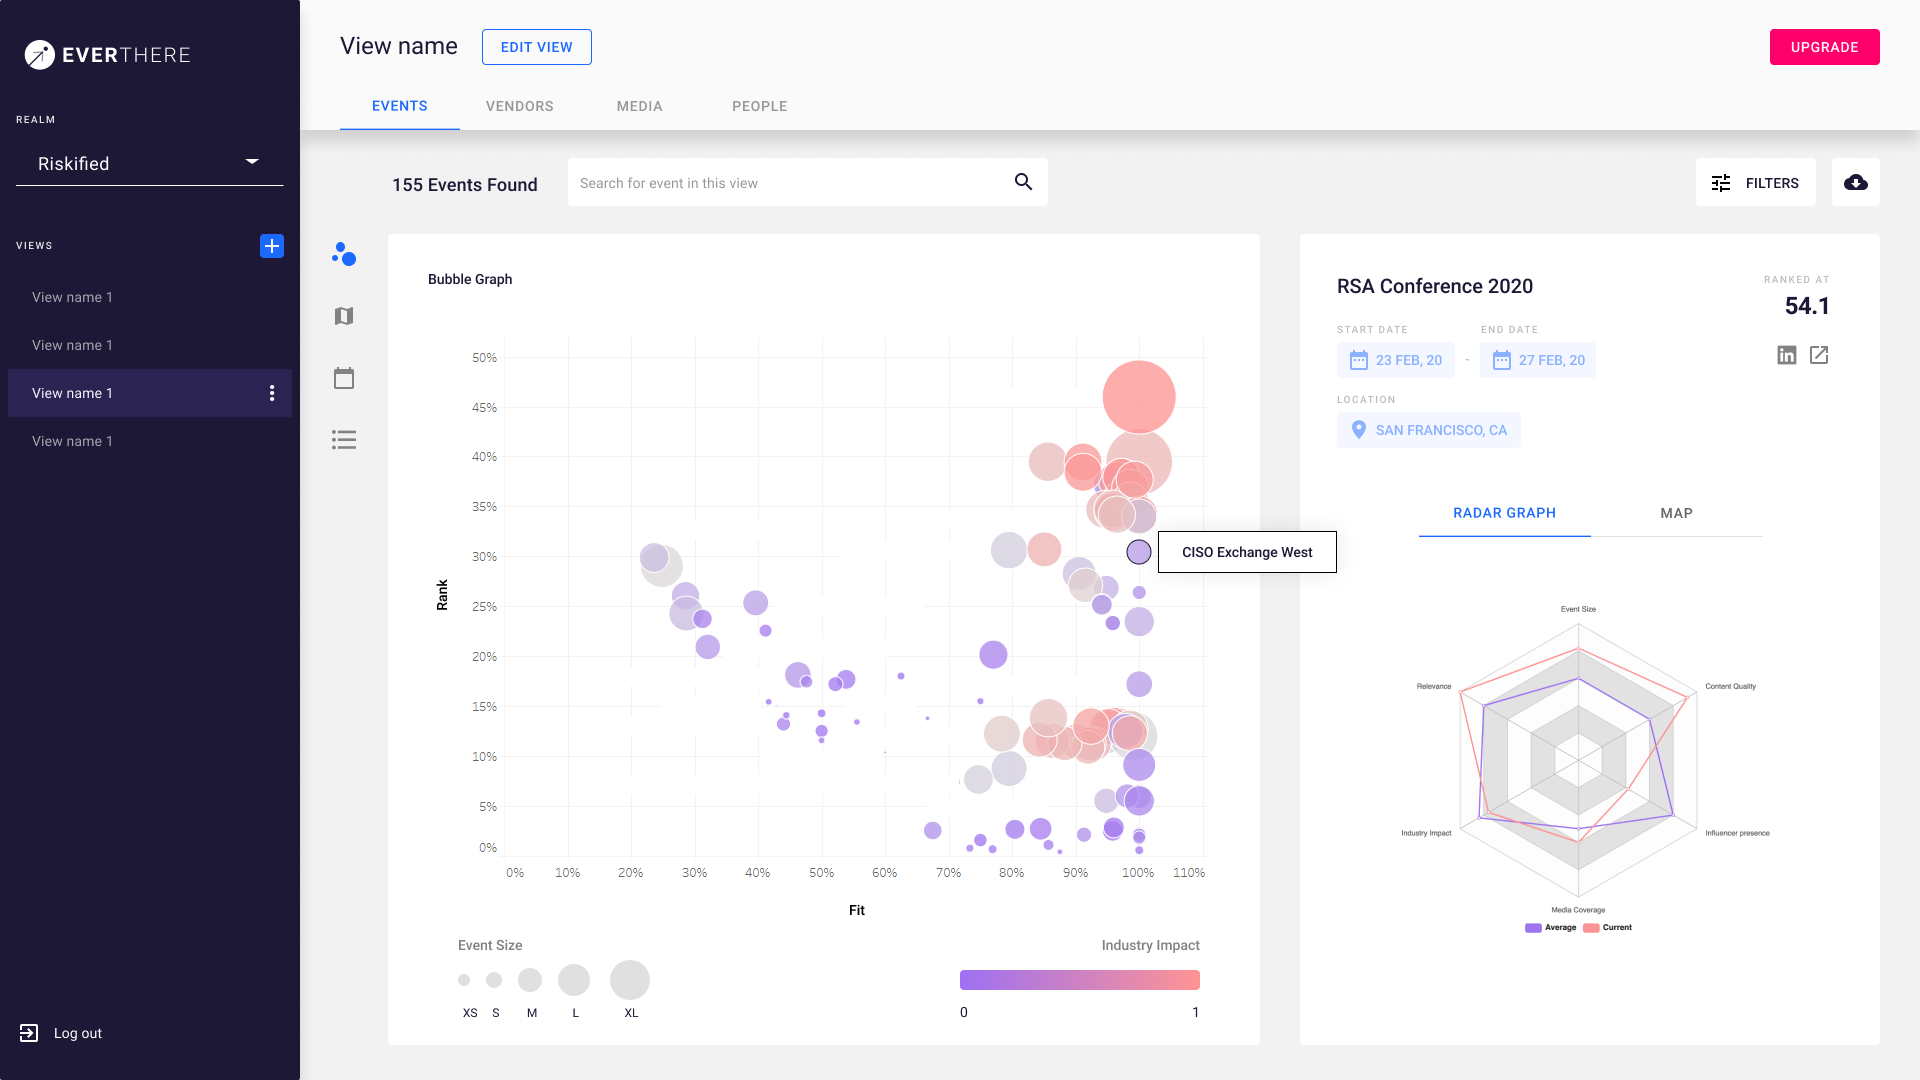
Get insights about the most relevant events, vendors, media, and people in your market
Insights can be viewed in a bubble graph, map, calendar or list view
The initial design was problematic for number of reasons:
The main navigation didn't support the information hierarchy
Using the tab menu for the data types didn’t support long texts
UI changes were mandatory :)
Now we had some time to make changes in the navigation and make some ui improvements.

Working on a new product meant releasing new features quickly and postponing ui improvements, that as a designer I thought were important.
Adding a new feature always included understanding the need, researching for examples and competitors, and aligning with the dev team to understand limitations.
In this competitive analysis dashboard example, I researched other dashboards (Google Analytics, Mixpanel, Similarweb, Intercom...) and had to align with the graphs library the dev team chose to use.

Most users found some of our data representation overwhelming, and preferred the simplicity of the list view. We understood that:
Marketing teams have different roles
Each role is a different user type
Each user type needs to consume the data differently
Therefore, we decided that new features will be released with a table view first, since tables show the same data as the graphs but in a simpler way.


Through my time at Everthere we used Typeform for the onboarding process. We started working on an integrated version of it, but we never got to develop it.

Creating a Design System was not a priority in this stage, but I maintained a component library.


I feel fortunate to have started my career in product design at Everthere. My technical background contributed to my communication with the developers and we had great teamwork.
My key learnings:
Working alongside with the developers and stakeholders
In an ongoing process of improving a product, there is a prioritization process as well
Working on a product is a process, and no product is perfect at first
Brainstorm, listen and compromise when needed